Powerful Charting Software for Advanced Data Visualization
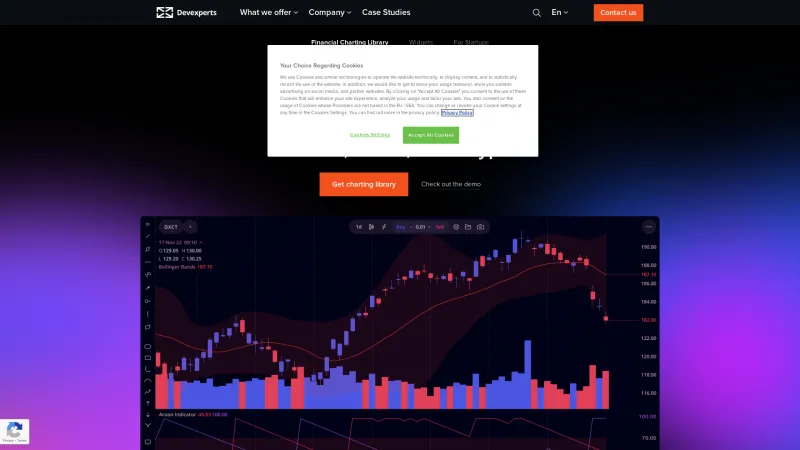
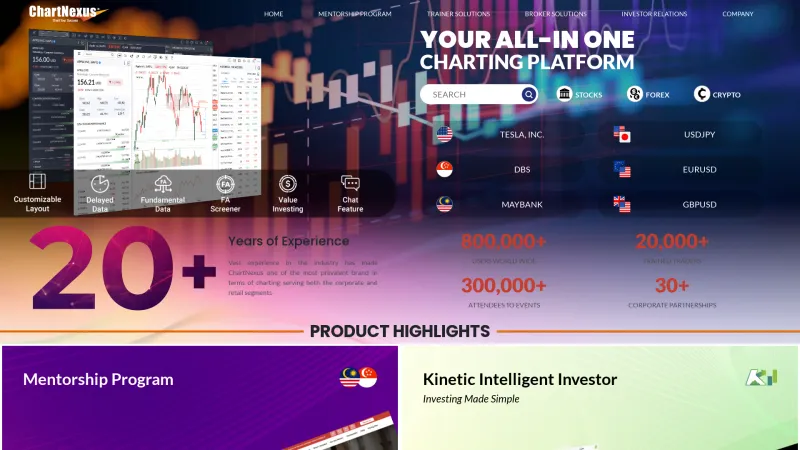
Charting software is a specialized tool designed to help users visualize data through various types of charts and graphs. This software addresses the need for clear and effective data representation, enabling users to analyze trends, patterns, and insights quickly. Read more
Key features of charting software typically include customizable chart types (such as bar, line, pie, and scatter plots), data import capabilities from various sources, real-time data updates, and interactive dashboards. These tools often come with advanced analytics features, allowing users to perform calculations and generate reports directly from the visualized data.
Charting software is best suited for professionals in fields such as finance, marketing, research, and education, where data-driven decision-making is crucial. It is also widely used by data analysts, business intelligence teams, and project managers who require robust visualization tools to communicate complex information effectively. By leveraging charting software, users can enhance their presentations, improve data comprehension, and drive informed business strategies.
