Transform Complex Data into Engaging Visuals
Data visualization software enables users to transform complex data sets into visually engaging and easily interpretable graphics. This category of software addresses the challenge of making data comprehensible, allowing users to identify trends, patterns, and insights that may not be immediately apparent in raw data. Read more
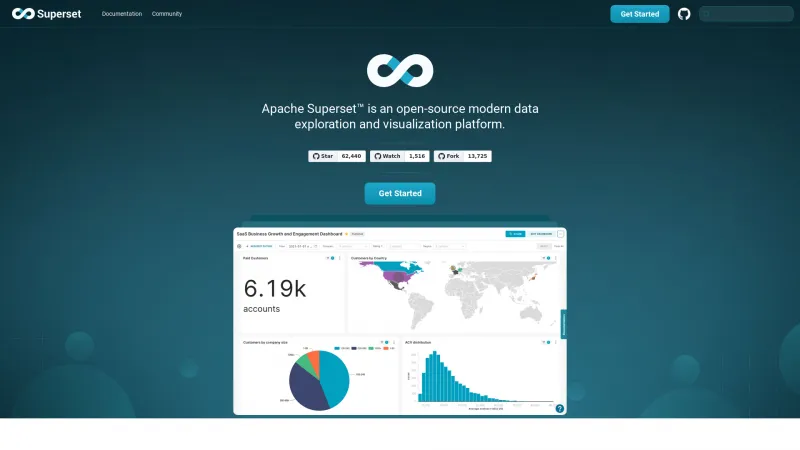
Key features often include customizable dashboards, interactive charts, and real-time data updates, which enhance the user experience and facilitate informed decision-making. These tools typically support various data sources, enabling seamless integration and analysis.
Data visualization software is best suited for professionals in fields such as business intelligence, marketing, finance, and research, where data-driven insights are crucial. By leveraging these tools, organizations can improve communication, enhance reporting capabilities, and drive strategic initiatives based on data analysis.
