JavaScript InfoVis Toolkit 2.0.1: Elevate Your Data Visualization with User-Friendly, Interactive Tools
JavaScript LibrariesDiscover the JavaScript InfoVis Toolkit for creating stunning interactive data visualizations. Explore demos, robust features, and comprehensive documentation for all skill levels.
About JavaScript InfoVis Toolkit
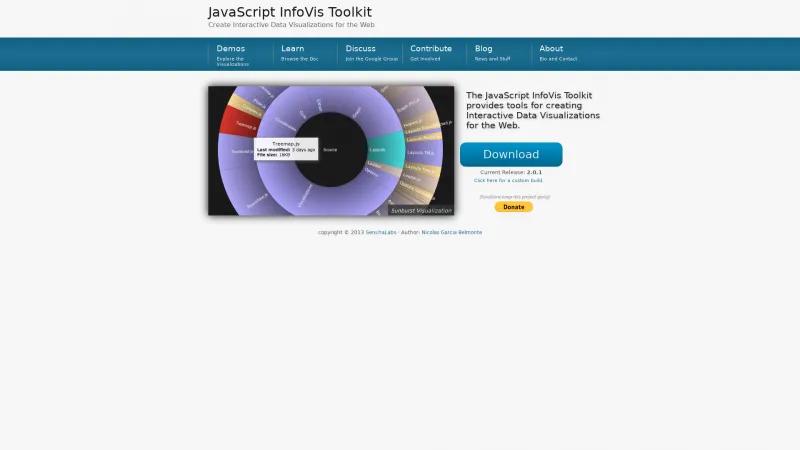
The JavaScript InfoVis Toolkit is an exceptional resource for developers and data enthusiasts looking to create interactive data visualizations for the web. With its user-friendly interface and robust features, it empowers users to transform complex data into engaging visual formats that enhance understanding and insight.
The toolkit's current release, version 2.0.1, showcases a variety of impressive demos that allow users to explore different visualization techniques, including the captivating Sunburst Visualization. This feature alone highlights the toolkit's capability to present hierarchical data in a visually appealing manner, making it easier for audiences to grasp intricate relationships within the data.
Moreover, the comprehensive documentation available ensures that both novice and experienced developers can navigate the toolkit with ease, facilitating a smooth integration into their projects. The active community, accessible through the Google Group, fosters collaboration and knowledge sharing, further enriching the user experience.
The commitment to continuous improvement is evident, as the toolkit encourages contributions and donations, ensuring its sustainability and evolution. Overall, the JavaScript InfoVis Toolkit stands out as a vital tool for anyone looking to elevate their data visualization efforts on the web. Its combination of functionality, community support, and ongoing development makes it a top choice for creating impactful visual narratives.
Leave a review
User Reviews of JavaScript InfoVis Toolkit
No reviews yet.
