FusionCharts: The Ultimate JavaScript Charting Library for Interactive Data Visualization
Data Visualization SoftwareDiscover FusionCharts, the ultimate JavaScript charting library for developers. Create stunning dashboards with 100+ interactive charts and real-time data visualization.
About FusionCharts
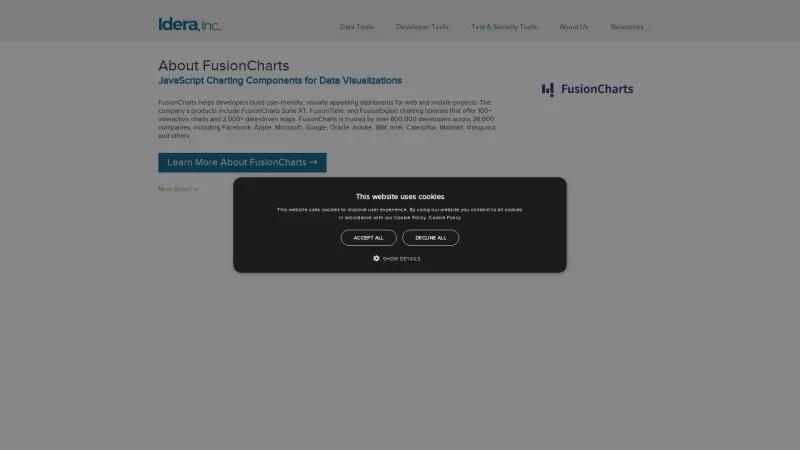
FusionCharts stands out as an exceptional choice for developers seeking a robust and versatile JavaScript charting library. With a comprehensive suite of products, including FusionCharts Suite XT, FusionTime, and FusionExport, it caters to a wide range of data visualization needs, whether for web or mobile applications.
One of the most impressive aspects of FusionCharts is its extensive library of over 100 interactive charts and 2,000+ data-driven maps. This variety allows developers to create visually appealing and informative dashboards that can handle both simple and complex data sets. The inclusion of domain-specific charts, such as Gantt and Heatmaps, further enhances its utility for specialized applications.
The ease of use is another significant advantage. Developers can create their first chart in just 15 minutes, thanks to a consistent API and comprehensive documentation filled with live examples. This user-friendly approach, combined with the ability to customize themes, makes FusionCharts an attractive option for both seasoned developers and newcomers alike.
Moreover, the platform's performance is noteworthy, particularly for applications requiring real-time data visualization. FusionCharts can render thousands, even millions, of data points seamlessly, making it ideal for financial and IoT applications.
The positive feedback from over 800,000 developers and 28,000 companies speaks volumes about the reliability and effectiveness of FusionCharts. Users have praised its customer service and the significant time savings it offers in creating impactful data presentations.
FusionCharts is a powerful tool that not only simplifies the process of data visualization but also enhances the overall user experience. Its combination of extensive features, ease of use, and strong community support makes it a top choice for developers looking to transform complex data into meaningful insights.
Heatmap Features
- Behavioral Mapping
- Dashboard
- Dynamic Maps
- Element Analytics
- Embeddable Maps
- For Sales
- Territorial Mapping
- Website Analytics
Dashboard Features
- Annotations
- Data Source Integrations
- Functions / Calculations
- Interactive
- KPIs
- Private Dashboards
- Public Dashboards
- Themes
- Visual Analytics
- Widgets
Gantt Chart Features
- Alerts/Notifications
- Capacity Monitoring
- Dependency Tracking
- Drag & Drop
- Milestone Tracking
- Progress Tracking
- Task Management
Data Visualization Features
- Analytics
- Dashboard Creation
- Filtered Views
- Relational Display
- Visual Discovery
Leave a review
User Reviews of FusionCharts
No reviews yet.
