Enhance Your Data Visualization with Pine BI: The Ultimate Excel Add-In for Dynamic Charts and Dashboards
Data Visualization SoftwareElevate your data visualization in Excel with Pine BI. Create dynamic charts and dashboards effortlessly, enhancing analysis and collaboration for all users.
About Pine BI
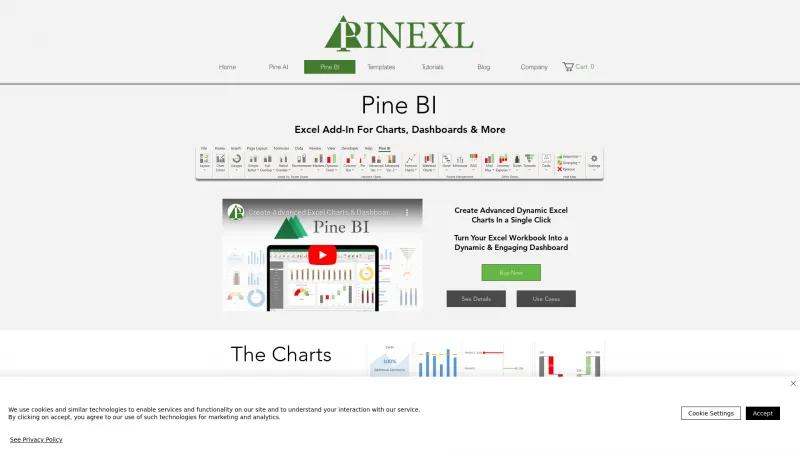
Pine BI is a game-changer for anyone looking to elevate their data visualization capabilities within Excel. This innovative Excel Add-In allows users to create advanced dynamic charts and dashboards with remarkable ease, transforming the way data is presented and analyzed.
One of the standout features of Pine BI is its ability to generate over 25 sophisticated chart types, including Waterfalls, Gantt Charts, and Actual vs. Target Charts, all with just a single click. This not only saves time but also eliminates the frustration of manually crafting complex visualizations. The intuitive Chart Editor further enhances the user experience, enabling the editing of multiple charts simultaneously and offering functionalities that are typically unavailable in standard Excel.
Moreover, Pine BI's seamless integration with PowerPoint and Word allows users to present their data dynamically, ensuring that stakeholders can engage with the information in real-time, even without the Add-In installed. This level of accessibility is invaluable for collaborative environments.
The user-friendly interface means that no coding skills or extensive training are required, making it accessible for professionals at all levels. Pine BI respects language preferences, ensuring that users can work in their native language, which is a thoughtful touch for international teams.
Pine BI is not just an Excel Add-In; it is a powerful tool that enhances data visualization, streamlines workflow, and fosters collaboration. For anyone serious about data analysis and presentation, Pine BI is an essential addition to their toolkit. Highly recommended!
Dashboard Features
- Annotations
- Data Source Integrations
- Functions / Calculations
- Interactive
- KPIs
- Private Dashboards
- Scorecards
- Visual Analytics
- Widgets
Gantt Chart Features
- Color Coding
- Milestone Tracking
- Progress Tracking
- Task Management
- Templates
Data Analysis Features
- Data Discovery
- Data Visualization
Data Discovery Features
- Visual Analytics
Data Visualization Features
- Analytics
- Dashboard Creation
- Visual Discovery
Leave a review
User Reviews of Pine BI
No reviews yet.

