Discover PyQtGraph: The Premier Python Library for Scientific Graphics and Real-Time Data Visualization
Component LibrariesDiscover PyQtGraph, the ultimate Python library for scientific graphics and GUI development. Enjoy fast, interactive 2D and 3D plotting, real-time data display, and advanced image analysis.
About PyQtGraph
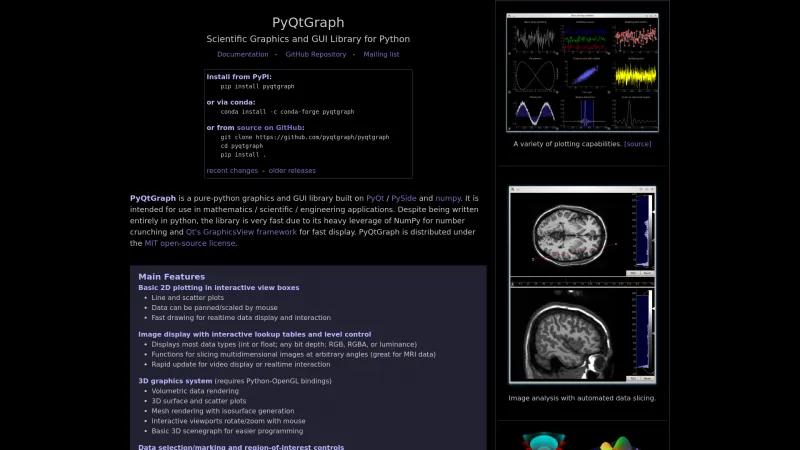
PyQtGraph stands out as an exceptional library for scientific graphics and GUI development in Python. Its extensive range of plotting capabilities, including 2D and 3D graphics, makes it an invaluable tool for researchers and engineers alike. The library's ability to handle real-time data display and interaction is particularly impressive, allowing users to visualize complex datasets with ease.
One of the standout features of PyQtGraph is its image analysis capabilities, which include automated data slicing and a variety of Region of Interest (ROI) types. This functionality is crucial for applications such as MRI data analysis, where precise data selection is essential. The interactive nature of the library enhances user experience, enabling seamless manipulation of data through intuitive controls.
The library's performance is noteworthy, as it leverages NumPy for efficient number crunching and Qt's GraphicsView framework for rapid rendering. This combination ensures that even large datasets can be processed and displayed without lag, making PyQtGraph a go-to choice for projects requiring speed and efficiency.
Moreover, PyQtGraph's flexibility is evident in its support for various platforms, including Linux, Windows, and OSX, and its ease of installation via pip or conda. The open-source nature of the library, distributed under the MIT license, further encourages collaboration and innovation within the scientific community.
The documentation provided is comprehensive, with numerous examples that facilitate learning and implementation. The active community support through forums and GitHub discussions ensures that users can easily find assistance and share insights.
In comparison to other Python graphics libraries, PyQtGraph excels in speed and interactivity, making it a superior choice for applications that demand rapid updates and real-time interaction. While libraries like Matplotlib are more established, PyQtGraph's advanced features and user-friendly interface make it a compelling alternative for those in need of a robust scientific graphics solution.
PyQtGraph is a powerful and versatile library that meets the needs of modern scientific and engineering applications. Its combination of speed, interactivity, and comprehensive features positions it as a leading choice for professionals seeking to enhance their data visualization capabilities. Highly recommended for anyone looking to elevate their Python projects in the realm of scientific graphics.
Leave a review
User Reviews of PyQtGraph
No reviews yet.
